
A new aptedge.io, $30k+ a year cheaper.

AptEdge's website ran on WordPress, and keeping it running cost more than $30k a year: managed hosting, paid plugin and theme licences, and an outside agency for changes. It also didn't show what the product does.

I designed a new site and built it in Next.js, page by page. Drag across each page below to compare the old site with the new one, and scroll to see the whole page.

  • Next.js
  • TypeScript
  • Design
  • WordPress migration
  • Cost
BeforedragAfter scroll the whole page
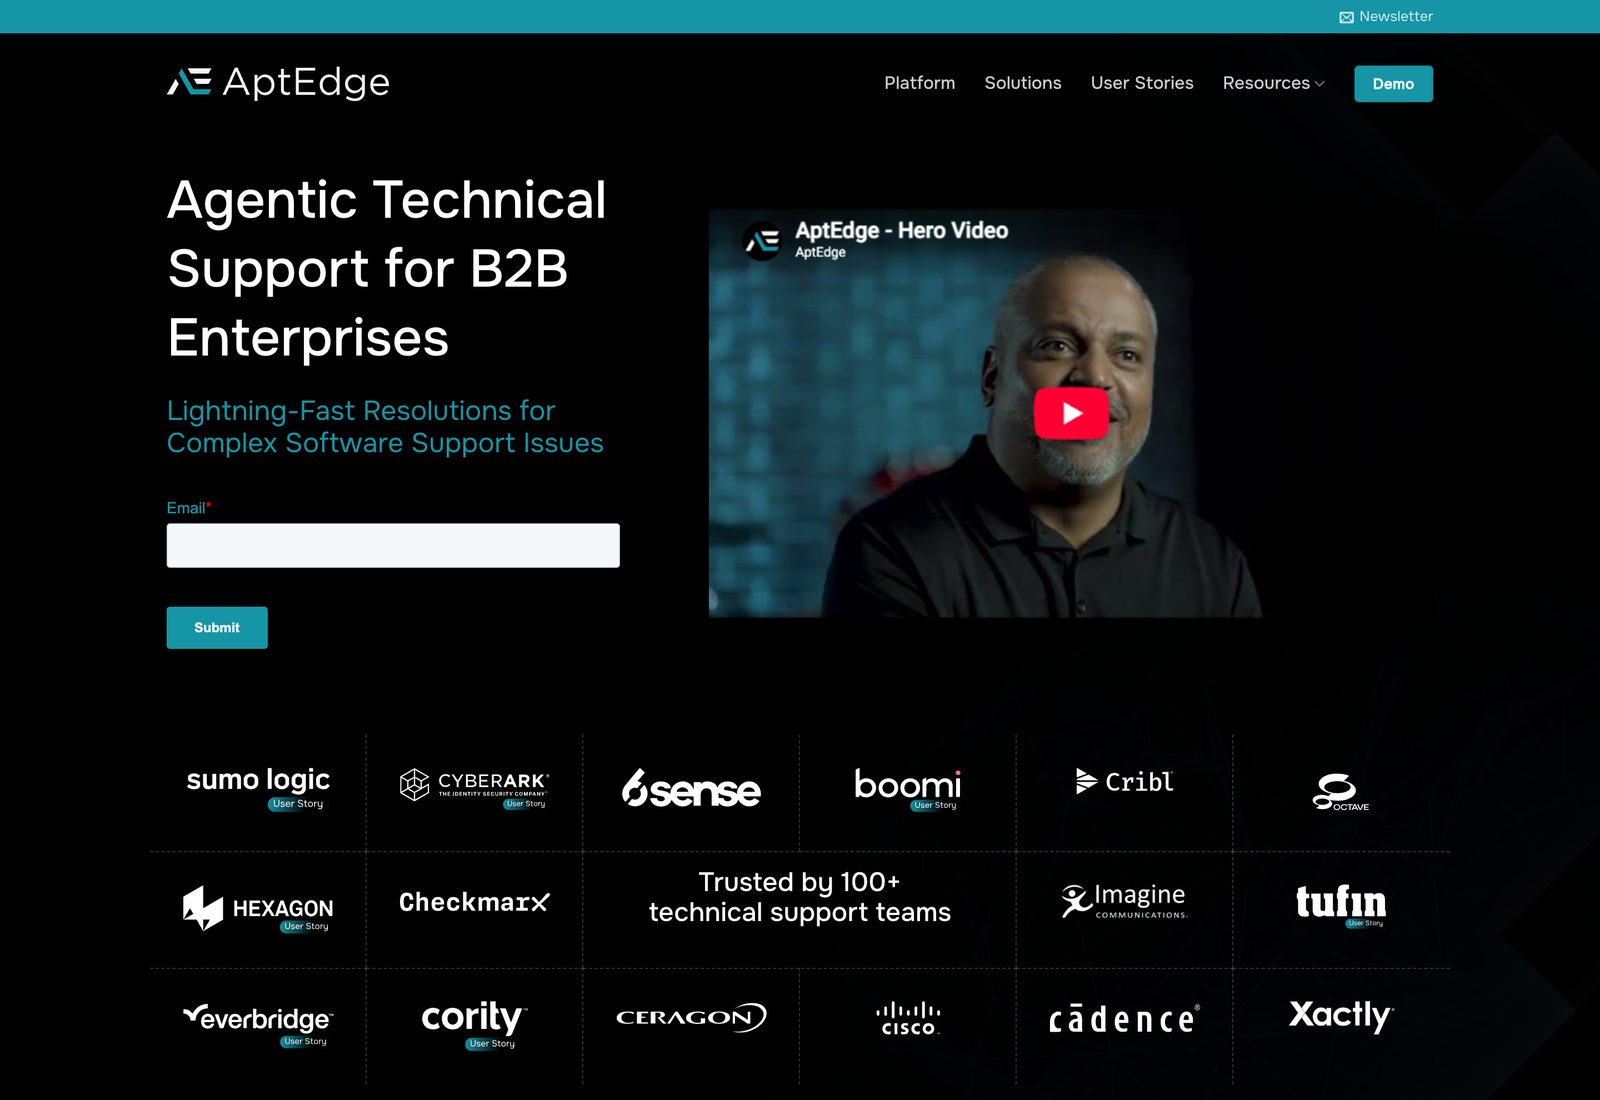
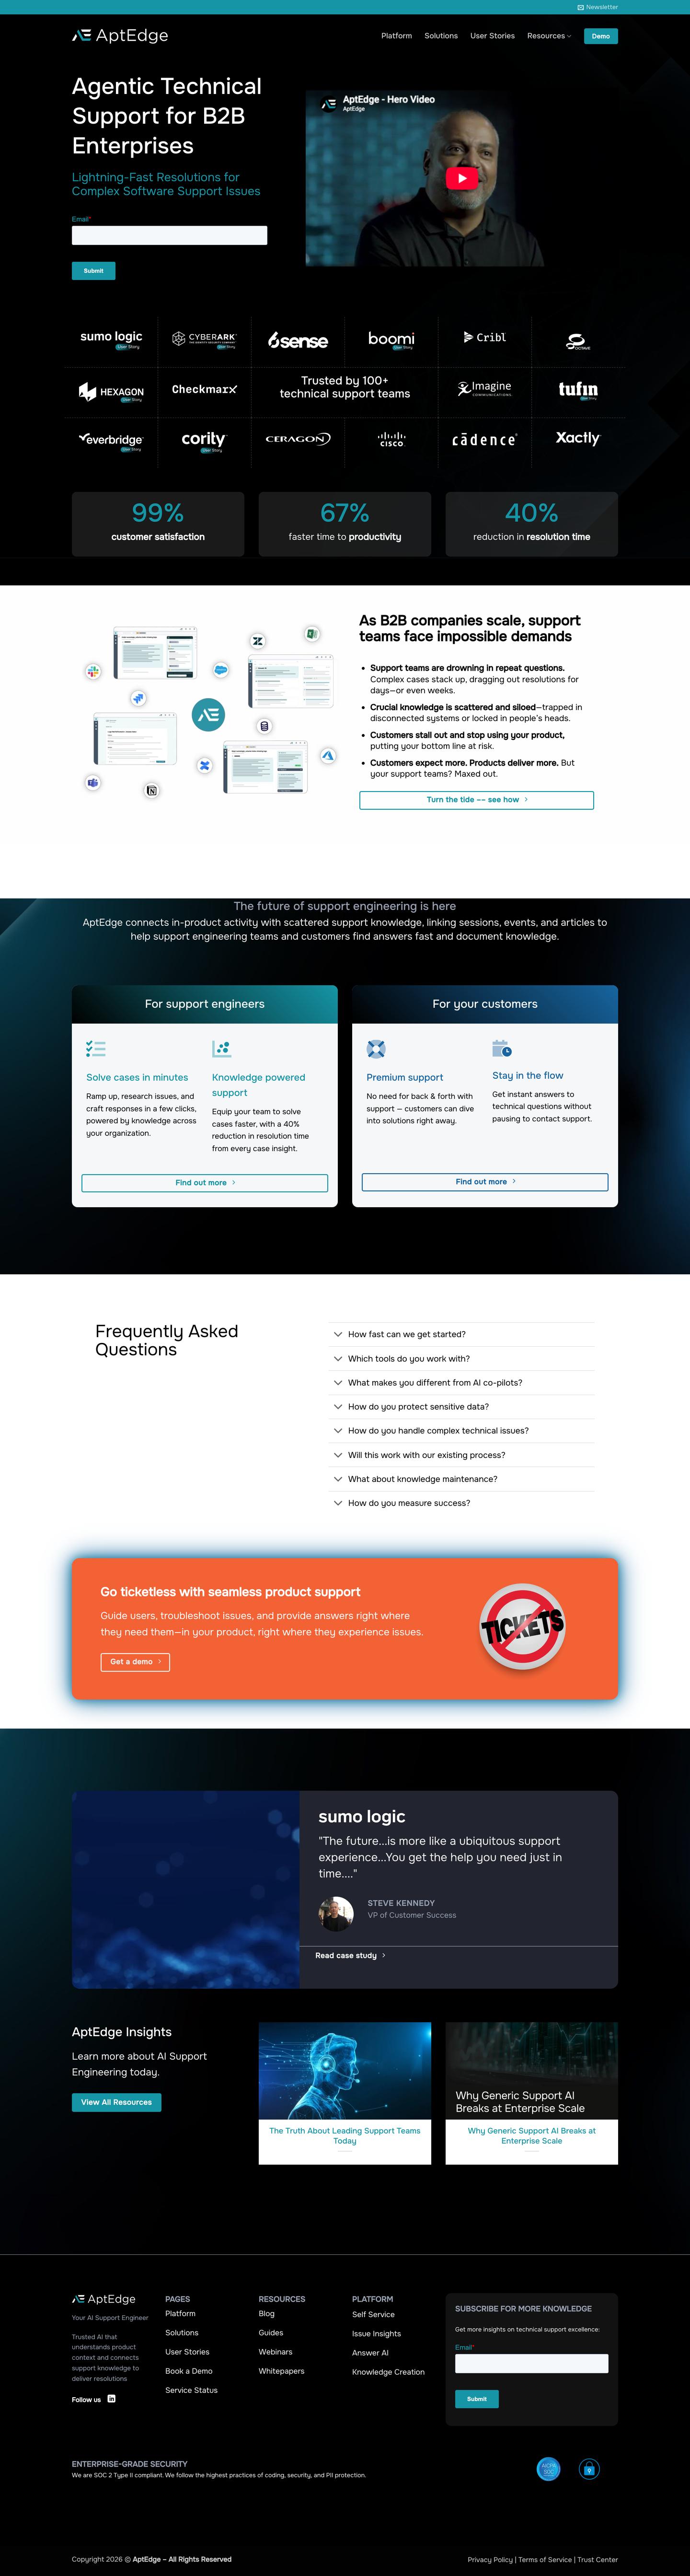
Website: Home before the redesign
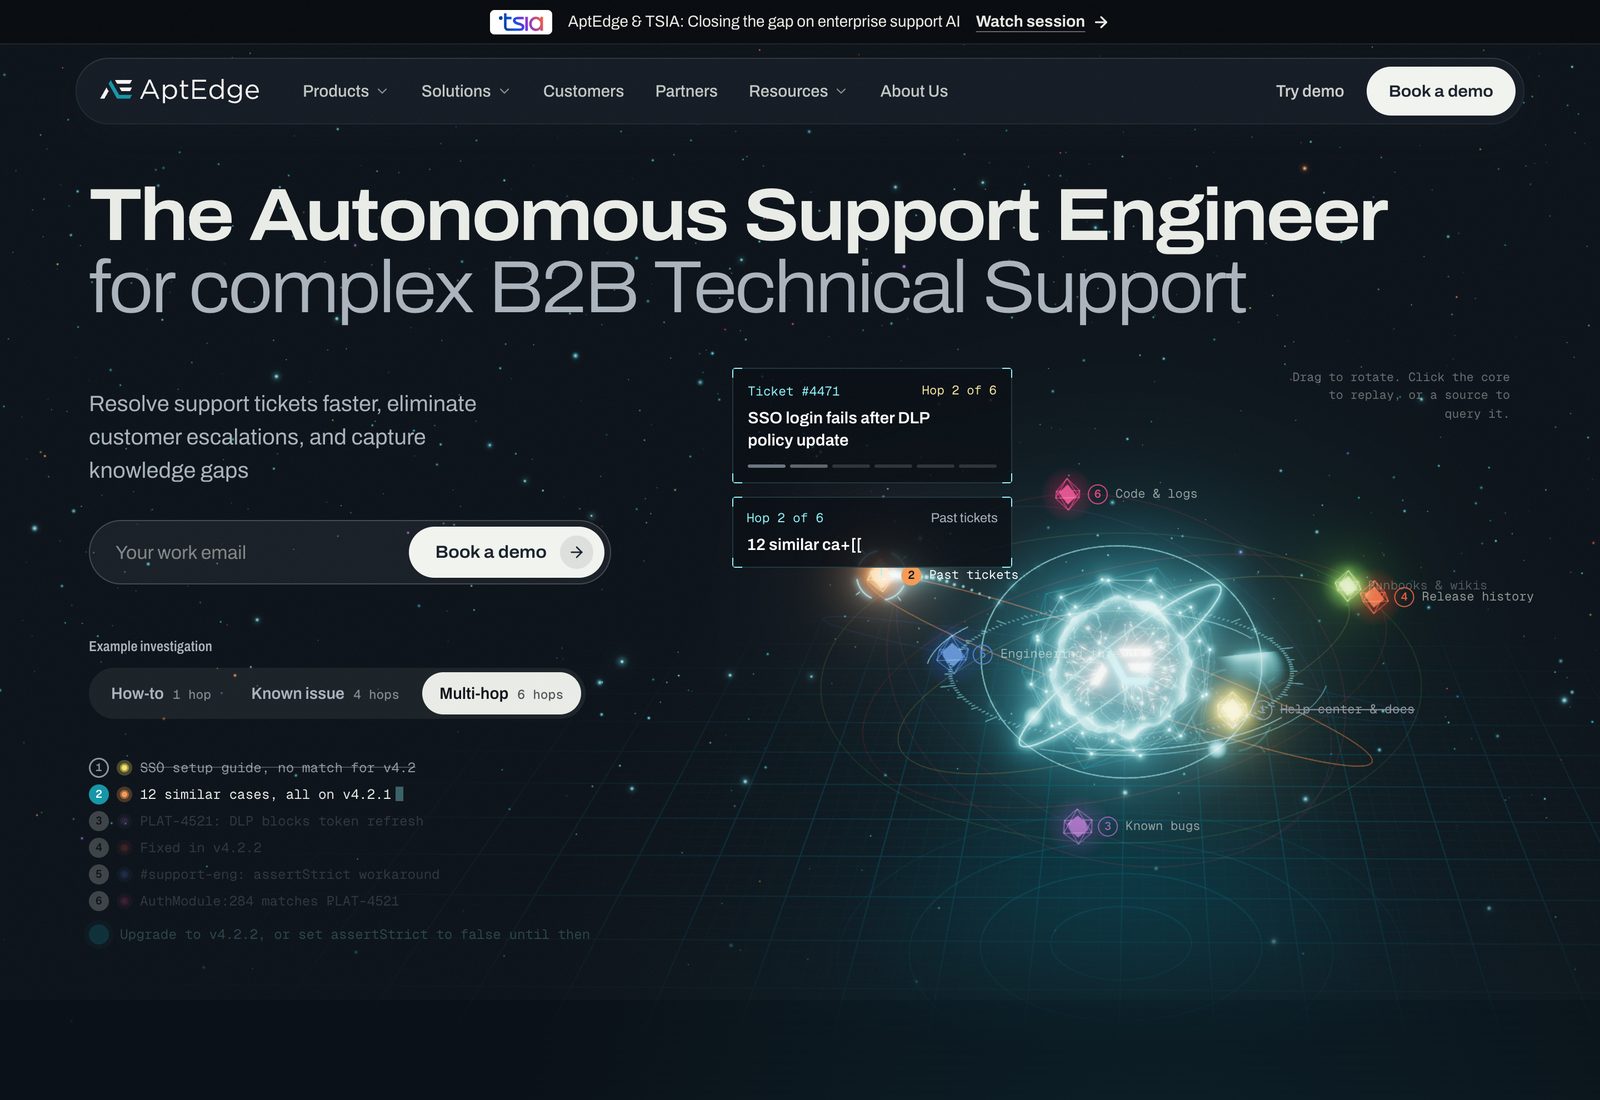
Website: Home after the redesign

A stock video and an email box became a live investigation: a 3D knowledge graph you can watch work a ticket, hop by hop.

WordPress cost $30k+ a year

Cause.
Managed hosting, paid plugin and theme licences, and an agency to make changes, every year.
Fix.
The site is now our own Next.js code. The WordPress hosting and licences are gone, and changes no longer go through an agency.

The site didn't show the product

Cause.
The home page led with a stock video and an email box. Nothing showed how AptEdge works a ticket.
Fix.
The new home page is a live investigation: a 3D knowledge graph that works a ticket hop by hop across the sources AptEdge reads.

Content was scattered

Cause.
Blog posts, guides, videos, webinars and whitepapers each had a page of their own.
Fix.
One resources library with filters and search, and customer stories that lead with the result.

Pages buyers look for were missing

Cause.
There was nothing on security, how AptEdge compares with other vendors, partners or the team.
Fix.
New About, Compare, Glossary, Partners and Security pages.

Results

Saved a year
WordPress$30k+
hosting, licences, agency fees
Page weight
3.90 MB3.90 MB
home page, mobile, Lighthouse
Server response
1,100 ms1,100 ms
home page, Lighthouse
Layout shift (CLS)
0.370.37
home page, mobile, Lighthouse
Resource pages
55
one library, filters and search
New pages
00
About, Compare, Glossary, Partners, Security

Where the $30k+ comes from

Managed WordPress hosting, paid plugin and theme licences, and the agency that maintained the old site, over a year. It's the yearly total, not an invoice-by-invoice audit.

How it was measured

Lighthouse 12.8 in Chrome, median of three runs on each site's home page, the old one on its WordPress host. These are lab numbers with simulated mobile throttling, so they compare the two sites rather than measure real visitors. The old site spent most of a second in WordPress before sending anything, loaded a 1.8 MB hero animation and a video player up front, and its hero moved three times while loading. One number went the wrong way: mobile LCP, 3.8s before and 5.4s now, from render-blocking CSS and text that fades in. That's the next fix.

What the screenshots show

Old pages are the WordPress site as it ran in production; new pages are the Next.js build. Each is the full page at 1440px wide. The blank stretch under the new home page's pinned hero is shortened, since a still capture can't show it pinned.

More case studies